Quick Start
This guide will help you get started with CNotebook in just a few minutes.
Basic Molecule Rendering
The simplest way to use CNotebook is to import it and display molecules:
import cnotebook
from openeye import oechem

# Create a molecule from SMILES
mol = oechem.OEGraphMol()
oechem.OESmilesToMol(mol, "c1ccccc1")
mol.SetTitle("Benzene")

# In a Jupyter/Marimo cell, simply display the molecule
mol  # Renders as a chemical structure
Outputs:
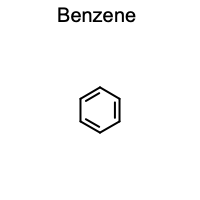
That’s it. CNotebook automatically registers formatters so that OpenEye molecule objects display as chemical structures instead of text representations.
Working with DataFrames
CNotebook integrates with Pandas and Polars DataFrames:
Pandas Example:
import cnotebook
import oepandas as oepd
import pandas as pd
# Create a DataFrame with SMILES
df = pd.DataFrame({
"Name": ["Benzene", "Pyridine", "Pyrimidine"],
"SMILES": ["c1ccccc1", "c1cnccc1", "n1cnccc1"]
})
# Convert SMILES to molecules
df.chem.as_molecule("SMILES", inplace=True)
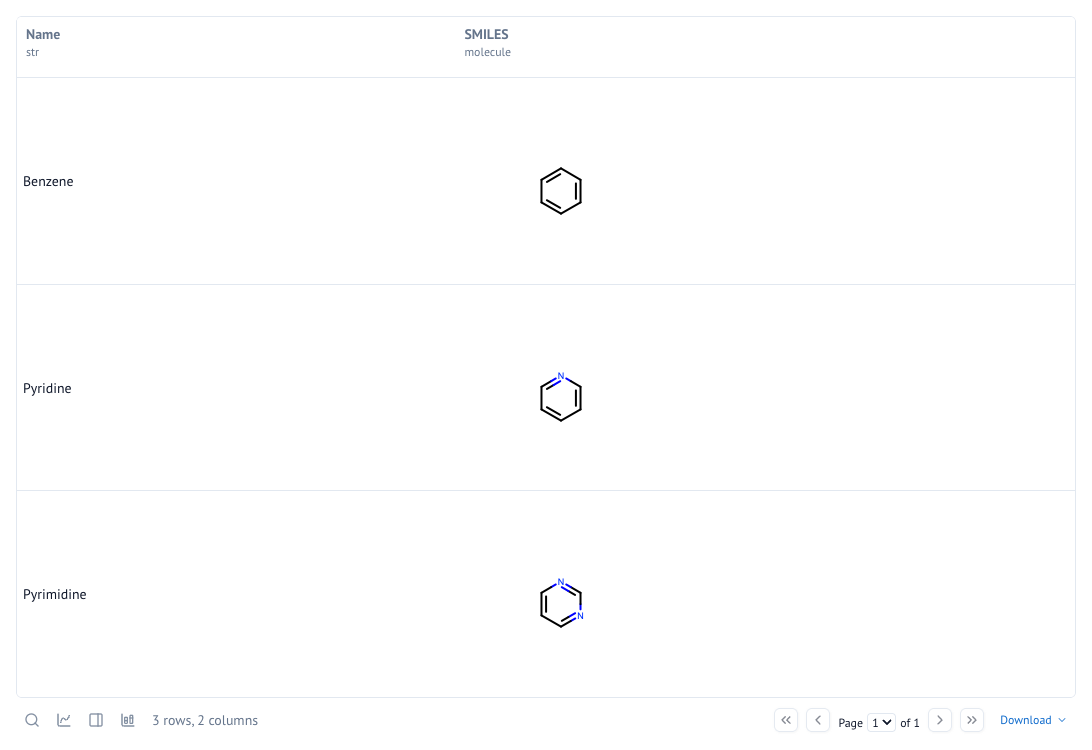
# Display the DataFrame - molecules render automatically
df
Will output:
| Name | SMILES | |
|---|---|---|
| 0 | Benzene | |
| 1 | Pyridine | |
| 2 | Pyrimidine |
Polars Example:
import cnotebook
import oepolars as oeplr
import polars as pl

# Create a DataFrame with SMILES
df = pl.DataFrame({
    "Name": ["Benzene", "Pyridine", "Pyrimidine"],
    "smiles": ["c1ccccc1", "c1cnccc1", "n1cnccc1"]
})

# Convert SMILES to molecules
df = df.chem.as_molecule("smiles")

# Display the DataFrame - molecules render automatically
df
This will output the DataFrame using the default built-in Marimo table UI with pagination and all other capabilities.
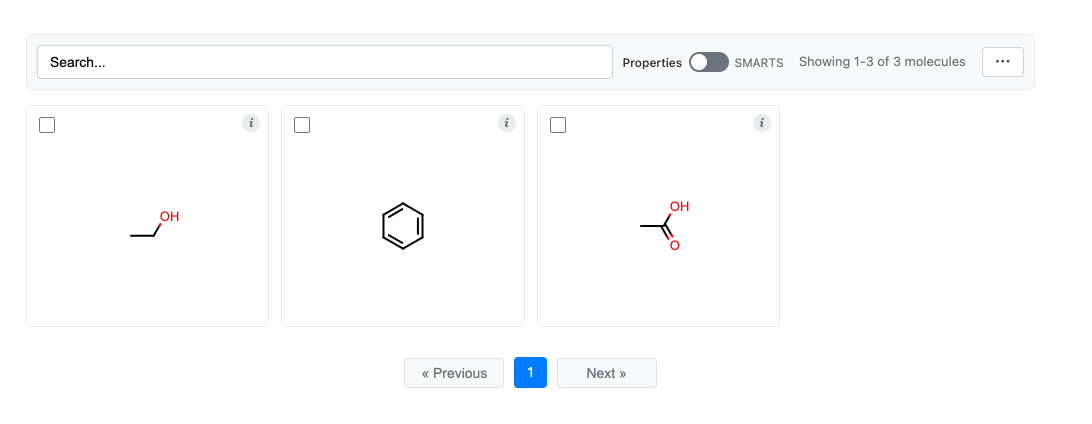
Using MolGrid
MolGrid provides an interactive grid for browsing molecules:
from cnotebook import molgrid
from openeye import oechem

# Create molecules
molecules = []
for smi in ["CCO", "c1ccccc1", "CC(=O)O"]:
    mol = oechem.OEGraphMol()
    oechem.OESmilesToMol(mol, smi)
    molecules.append(mol)

# Display interactive grid
grid = molgrid(molecules)
grid.display()

# Later, retrieve selected molecules
selected = grid.get_selection()
For more details, see the MolGrid: Interactive Molecule Grids documentation.
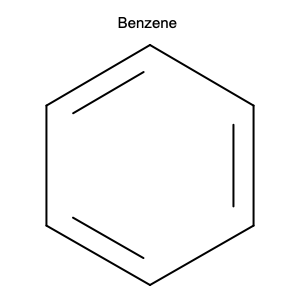
Customizing Rendering
You can customize rendering through the global context. Settings will automatically propogate down to rendering other objects such DataFrames, keeping rendering uniform. You can also use local rendering contexts as well.
# Access the rendering context
ctx = cnotebook.cnotebook_context.get()

ctx.width = 300
ctx.height = 300
ctx.title_font_scale = 0.25
ctx.structure_scale = oedepict.OEScale_AutoScale
You can always reset the contex to default values with ctx.reset().
Environment Support
Nearly all code in this package works seemlessly with Pandas, Polars, Jupyter and Marimo.
Next Steps
Basic Rendering - Detailed rendering options and customization
DataFrame Integration - DataFrame integration guide
MolGrid: Interactive Molecule Grids - Interactive molecule grid documentation
API Reference - Full API reference