DataFrame Integration
CNotebook provides seamless integration with Pandas and Polars DataFrames through
the chem accessor, enabling chemistry-aware operations on molecular data.
Pandas Integration
Prerequisites
pip install "cnotebook[pandas]"
Creating Molecule Columns
Convert SMILES strings to molecule objects:
import cnotebook
import oepandas as oepd
import pandas as pd

df = pd.DataFrame({
    "Name": ["Benzene", "Pyridine", "Pyrimidine"],
    "Molecule": ["c1ccccc1", "c1cnccc1", "n1cnccc1"]
})

# Convert SMILES column to molecules (in place)
df.chem.as_molecule("Molecule", inplace=True)

# Display the DataFrame
df
You should see:
| Name | Molecule | |
|---|---|---|
| 0 | Benzene | |
| 1 | Pyridine | |
| 2 | Pyrimidine |
Note
Molecule columns automatically render as chemical structures when displaying
the DataFrame. This also works for anything that returns a DataFrame, such
as df.head().
Creating Query Columns
OEPandas query columns use QueryDtype and render through the same CNotebook
depiction path as molecule columns:
import cnotebook
import oepandas as oepd
import pandas as pd

queries = pd.DataFrame({
    "Name": ["Alcohol query", "Nitrogen query"],
    "Query": ["[#6]-[#8]", "[#7]"],
})

queries.chem.as_query("Query", inplace=True)
queries["Query"].chem.set_render_options(image_format="svg", title=False)
queries
Substructure Highlighting
You can highlight a substructures within a DataFrame column using SMARTS. By default this uses ball-and-stick-style
highlighting that supports overlapping matches, using the oechem.OEGetLightColors() scheme.
# Highlight a single pattern using the DataFrame above
df.Molecule.chem.highlight("c1ccccc1")  # Highlight benzene rings

# Display the DataFrame
df
Outputs:
| Name | Molecule | |
|---|---|---|
| 0 | Benzene | |
| 1 | Pyridine | |
| 2 | Pyrimidine |
Note
Highlighting persists until you remove it with df.chem.clear_formatting_rules() for a DataFrame or
df["column_name"].clear_formatting_rules().
You can also use any of the normal highlighting capabilities:
# Highlight using normal stick highlighting
df.Molecule.chem.highlight("c1ccccc1", style=oedepict.OEHighlightStyle_Stick, color=oechem.OELightBlue)

# Display the DataFrame
df
| Name | Molecule | |
|---|---|---|
| 0 | Benzene | |
| 1 | Pyridine | |
| 2 | Pyrimidine |
Finally, you can highlight a substructure based on the value in another column, rather than a fixed pattern:
# Add a different pattern for each row
df["Pattern"] = ["cc", "cnc", "ncn"]

# Highlight using that pattern with a slightly different style
df.chem.highlight_using_column("SMILES", "Pattern")
| Name | Molecule | Pattern | highlighted_substructures | |
|---|---|---|---|---|
| 0 | Benzene | cc | ||
| 1 | Pyridine | cnc | ||
| 2 | Pyrimidine | ncn |
Note that this creates a new column with display objects instead of molecules.
Molecular Alignment
Align molecule depictions for visual comparison:
import cnotebook
import oepandas as oepd

# Read the example unaligned molecules
df = oepd.read_sdf("examples/assets/rotations.sdf", no_title=True)

# Rename the "Molecule" column to "Original" so that we can
# see the original unaligned molecules
df = df.rename(columns={"Molecule": "Original"})

# Create a new molecule column called "Aligned" so that we can
# see the aligned molecules
df["Aligned"] = df.Original.chem.copy_molecules()

# Align the depictions based on the first molecule
# By default this does a path fingerprint-based alignment
df.Aligned.chem.align_depictions("first")

# Show the structures
df.head()
Outputs:
| Original | Aligned | |
|---|---|---|
| 0 | ||
| 1 | ||
| 2 |
The align_depictions method accepts the following parameters:
Parameter |
Description |
Default |
|---|---|---|
|
Alignment reference. Can be:
|
Required |
|
Alignment method. Can be:
|
|
Fingerprint Similarity
Color molecules by similarity to a reference:
import cnotebook
import oepandas as oepd
from openeye import oechem, oedepict

# Read the example EGFR molecule file
df = oepd.read_smi("examples/assets/egfr.smi")

# Use Gefitinib as a reference
# We call oedepict.OEPrepareDepiction to give the SMILES string nice 2D coordinates
gefitinib = oechem.OEGraphMol()
oechem.OESmilesToMol(gefitinib, "COc1cc2c(cc1OCCCN3CCOCC3)c(ncn2)Nc4ccc(c(c4)Cl)F")

# Align all molecules to Gefitinib
df.Molecule.chem.align_depictions(gefitinib)

# Show similarity to Gefitinib
df.chem.fingerprint_similarity("Molecule", gefitinib, inplace=True)

# Show just the fingerprint similarity
df[["reference_similarity", "target_similarity"]]
This will output aligned structures that are colored by fingerprint similarity for both the target and reference:
| reference_similarity | target_similarity | |
|---|---|---|
| 0 | ||
| 1 | ||
| 2 | ||
| 3 | ||
| 4 |
Polars Integration
Prerequisites
pip install "cnotebook[polars]"
Creating Molecule Columns
Convert SMILES strings to molecule objects:
import cnotebook
import oepolars as oeplr
import polars as pl

df = pl.DataFrame({
    "Name": ["Benzene", "Pyridine", "Pyrimidine"],
    "smiles": ["c1ccccc1", "c1cnccc1", "n1cnccc1"]
}).chem.as_molecule("smiles")

# Display the DataFrame
df
This outputs the same styled DataFrame (depending on whether you are using Jupyter or Marimo):
| Name | smiles |
|---|---|
| Benzene | |
| Pyridine | |
| Pyrimidine |
DataFrames display automatically in both Jupyter and Marimo when left as a bare statement at the end of a cell.
Reading Molecule Files
Read molecules directly from files:
# Read from SMILES file
df = oeplr.read_smi("molecules.smi")

# Read from SDF file
df = oeplr.read_sdf("molecules.sdf")
Substructure Highlighting
Substructure highlighting must be done at the DataFrame level in Polars due to it’s architecture. It works exactly
the same was as Pandas otherwise. By default this uses ball-and-stick-style highlighting that supports overlapping
matches, using the oechem.OEGetLightColors() scheme.
# Highlight a single pattern using the DataFrame above
df.chem.highlight("smiles", "c1ccccc1")  # Highlight benzene rings

# Display the DataFrame
df
Outputs:
| Name | smiles |
|---|---|
| Benzene | |
| Pyridine | |
| Pyrimidine |
Note
Highlighting persists until you remove it with df.chem.clear_formatting_rules()
Finally, you can highlight a substructure based on the value in another column, rather than a fixed pattern:
# Add a column with patterns to highlight
df = df.with_columns(
    pl.Series("Pattern", ["cc", "cnc", "ncn"])
)

# Highlight each row using the Pattern column
df = df.chem.highlight_using_column("smiles", "Pattern")

# Display the DataFrame
df
| Name | smiles | Pattern | highlighted_substructures |
|---|---|---|---|
| Benzene | cc | ||
| Pyridine | cnc | ||
| Pyrimidine | ncn |
Molecular Alignment
Align molecule depictions:
import cnotebook
import oepolars as oepl

# Read the example unaligned molecules
df = oepl.read_sdf("examples/assets/rotations.sdf", no_title=True)

# # Rename the "Molecule" column to "Original" so that we can
# # see the original unaligned molecules
df = df.rename({"Molecule": "Original"})

# # Create a new molecule column called "Aligned" so that we can
# # see the aligned molecules
df = df.chem.copy_molecules("Original", "Aligned")

# Align the depictions based on the first molecule
# By default this does a path fingerprint-based alignment
df["Aligned"].chem.align_depictions("first")

# Show the structures
df.head()
This will output:
| Original | Aligned |
|---|---|
The align_depictions method accepts the following parameters:
Parameter |
Description |
Default |
|---|---|---|
|
Alignment reference. Can be:
|
Required |
|
Alignment method. Can be:
|
|
Fingerprint Similarity
Color molecules by similarity:
import cnotebook
import oepolars as oepl
from openeye import oechem, oedepict

# Read the example EGFR molecule file
df = oepl.read_smi("examples/assets/egfr.smi")

# Use Gefitinib as a reference
# We call oedepict.OEPrepareDepiction to give the SMILES string nice 2D coordinates
gefitinib = oechem.OEGraphMol()
oechem.OESmilesToMol(gefitinib, "COc1cc2c(cc1OCCCN3CCOCC3)c(ncn2)Nc4ccc(c(c4)Cl)F")

# Align all molecules to Gefitinib
df["Molecule"].chem.align_depictions(gefitinib)

# Show similarity to Gefitinib
df = df.chem.fingerprint_similarity("Molecule", gefitinib, inplace=True)

# # Show just the fingerprint similarity
df[["reference_similarity", "target_similarity"]]
This outputs:
| reference_similarity | target_similarity |
|---|---|
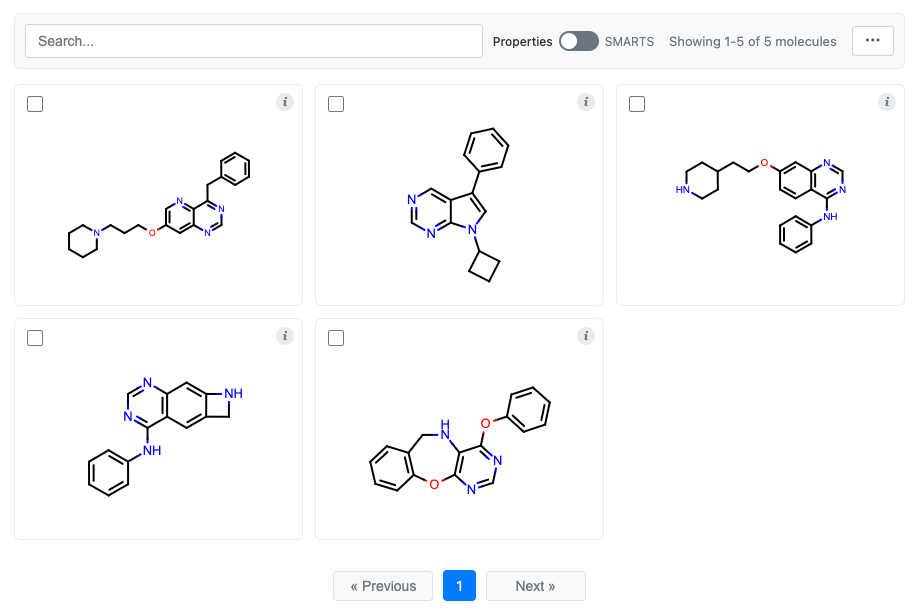
MolGrid from DataFrames
Create interactive molecule grids from DataFrames:
Pandas:
from cnotebook import MolGrid
import oepandas as oepd

# Read the example EGFR molecule file
df = oepd.read_smi("examples/assets/egfr.smi")

# 1. Create a molecule grid with all data
grid = df.chem.molgrid("Molecule")

# 2. Create a molecule grid with only the molecule series (no data)
# df = df["Molecule"].chem.molgrid()

# Display the grid
grid.display()
This outputs:
Polars:
The exact same code works above, just swap out oepolars for oepandas:
from cnotebook import MolGrid
import oepolars as oepl

# Read the example EGFR molecule file
df = oepl.read_smi("examples/assets/egfr.smi")

# 1. Create a molecule grid with all data
grid = df.chem.molgrid("Molecule")

# 2. Create a molecule grid with only the molecule series (no data)
# df = df["Molecule"].chem.molgrid()

# Display the grid
grid.display()
You should get the exact same molecule grid as with Pandas.
See the molgrid-class documentation for more details on MolGrid features.
Best Practices
Memory Management: For large datasets, consider using molecule indices rather than storing full molecule objects in memory.
Performance: Use PNG format for faster rendering of large DataFrames. SVG provides better quality but may be slower for many molecules.
Column Naming: Use descriptive column names and avoid conflicts with reserved names like “Molecule” when possible.
Lazy Evaluation: When using Polars, take advantage of lazy evaluation for complex operations on large datasets.