MolGrid: Interactive Molecule Grids
MolGrid provides an interactive grid visualization for browsing, searching, and selecting molecules. It is designed for exploring large molecular datasets with powerful filtering and selection capabilities.
Overview
Key features of MolGrid:
Pagination: Navigate large datasets with configurable items per page
Text Search: Filter by molecule titles and properties
SMARTS Search: Substructure filtering using SMARTS patterns
Selection: Select molecules with checkboxes or click-to-select
Export: Export selected molecules to SMILES or CSV files
Info Tooltips: View molecular data with click-to-pin tooltips
DataFrame Integration: Automatic field detection from DataFrames
Generic and SD Data: Recognizes OpenEye generic data and/or SD data on molecules
Cluster Viewing: Filter and browse molecules by cluster labels
Basic Usage
Creating a Simple Grid
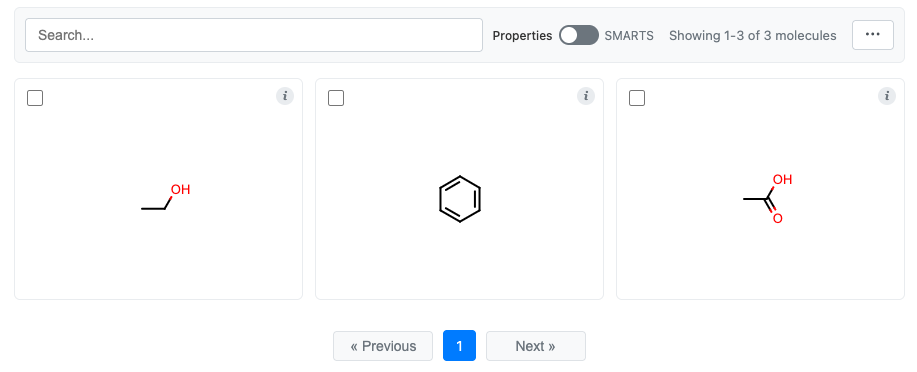
You can create a molecule grid from any iterable.
from cnotebook import MolGrid
from openeye import oechem

# Create molecules
molecules = []
for smi in ["CCO", "c1ccccc1", "CC(=O)O"]:
    mol = oechem.OEGraphMol()
    oechem.OESmilesToMol(mol, smi)
    molecules.append(mol)

# Create and display grid
grid = MolGrid(molecules)
grid.display()
See molgrid-class for the complete list of options.
Selection
You can select molecules and then retrieve the selections later in the same notebook.
Enabling Selection
Selection is enabled by default:
grid = MolGrid(molecules, select=True)   # Enabled (default)
grid = MolGrid(molecules, select=False)  # Disable molecule selection
Selection Methods
Multiple ways to select molecules:
Click on a molecule to toggle its selection
Click the checkbox in the top-left corner
Use the Actions menu (”…” button):
Select All: Select all visible molecules
Clear Selection: Deselect all molecules
Invert Selection: Toggle selection state of all visible molecules
Retrieving Selections
Let’s make a selection in the simple molecule grid that we created above.
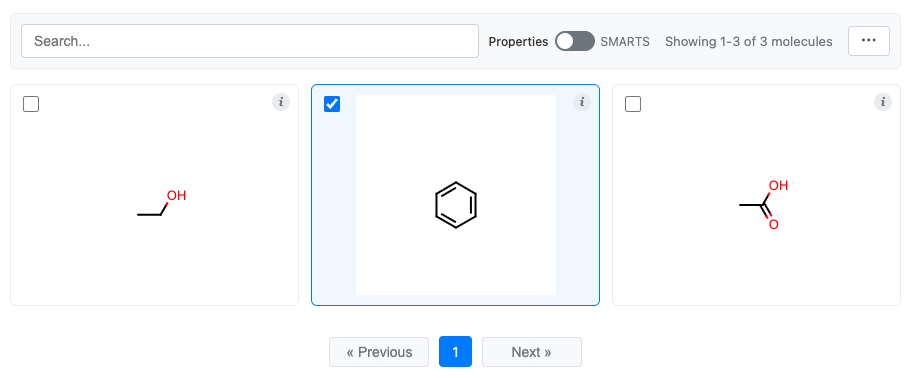
You can now retrieve the selection in two different ways:
# Get selected molecule objects
selected_mols = grid.get_selection()
print(f'Selected molecules: {", ".join(map(oechem.OEMolToSmiles, selected_mols))}')

# Get selected indices
indices = grid.get_selection_indices()
print(f"Selected indices: {indices}")
This prints:
Selected molecules: c1ccccc1
Selected indices: [1]
Exporting Selections
Use the Actions menu to export selected molecules:
Copy to Clipboard: Copy as CSV to clipboard
Save to SMILES: Download as .smi file
Save to CSV: Download as .csv file with all data columns
Customizing the Display
Image Settings
Control the size and format of molecule images:
grid = MolGrid(
    molecules,
    width=150,                  # Image width in pixels
    height=150,                 # Image height in pixels
    image_format="svg",         # "svg" or "png"
    atom_label_font_scale=1.5,  # Scale factor for atom labels
)
Pagination
Control how many molecules appear per page:
grid = MolGrid(
    molecules,
    n_items_per_page=24,  # Molecules per page (default: 24)
)
Title Display
Control molecule title display:
# Show titles from molecule's built-in title (default)
grid = MolGrid(molecules, title=True)

# Show titles from SD data field
grid = MolGrid(molecules, title="Name")

# Hide titles
grid = MolGrid(molecules, title=None)
Search and Filtering
MolGrid provides two search modes accessible via the toggle in the toolbar:
Text Search
Search across molecule titles and configured search fields:
# Configure which fields are searchable
grid = MolGrid(
    molecules,
    search_fields=["Name", "Category"],
)
When using a DataFrame, string columns are automatically detected as searchable.
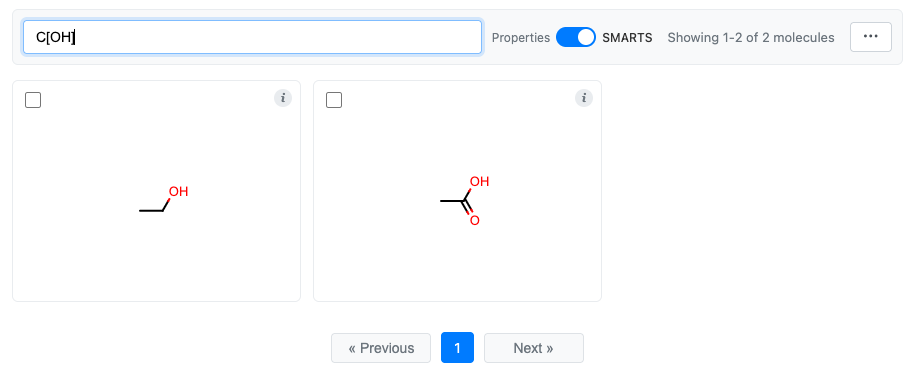
SMARTS Mode (Substructure Search)
Filter molecules by SMARTS substructure patterns. Switch to SMARTS mode using the toggle in the toolbar, then enter a SMARTS pattern.
Info Button and Tooltips
Each molecule cell has an info button (“i”) in the top-right corner.
Hover over the “i” to see the tooltip
Click the “i” to pin the tooltip open
Click again to unpin
This allows comparing data across multiple molecules by pinning multiple tooltips.
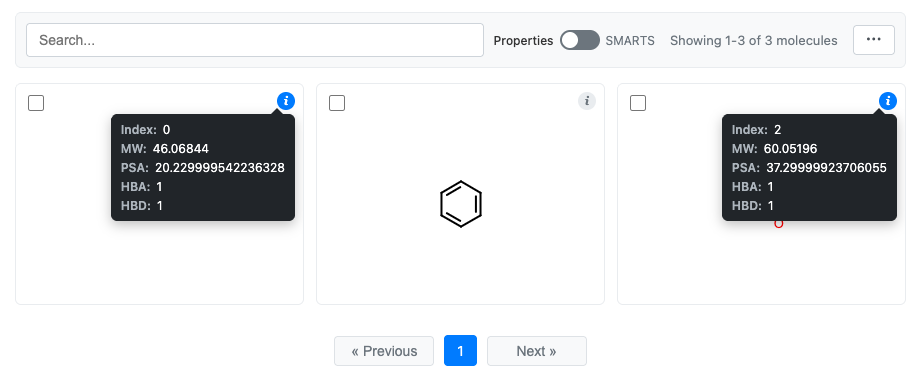
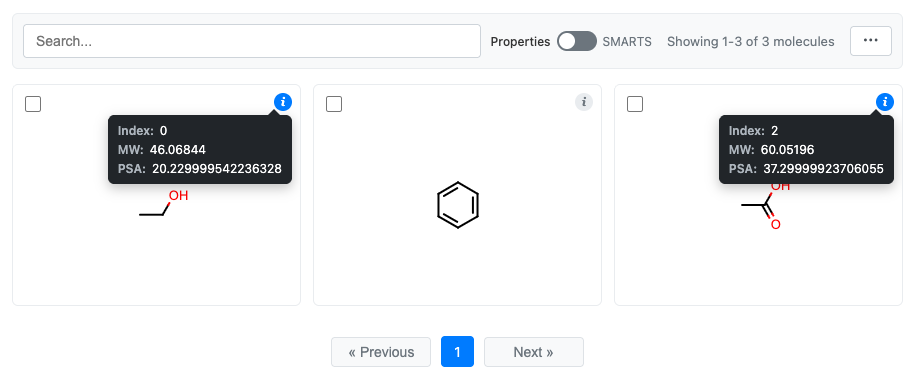
Here is an example using a DataFrame:
import pandas as pd
from cnotebook import MolGrid
from openeye import oechem, oemolprop

# Create DataFrame
df = pd.DataFrame(
    {"Molecule": ["CCO", "c1ccccc1", "CC(=O)O"]}
).chem.as_molecule("Molecule")

# Calculate some properties
df["MW"] = df.Molecule.apply(oechem.OECalculateMolecularWeight)
df["PSA"] = df.Molecule.apply(oemolprop.OEGet2dPSA)
df["HBA"] = df.Molecule.apply(oemolprop.OEGetHBondAcceptorCount)
df["HBD"] = df.Molecule.apply(oemolprop.OEGetHBondDonorCount)

# Display the grid (using the 'Molecule' column for structures)
grid = df.chem.molgrid("Molecule")
grid.display()
Clicking the “i” for the first and last molecules:
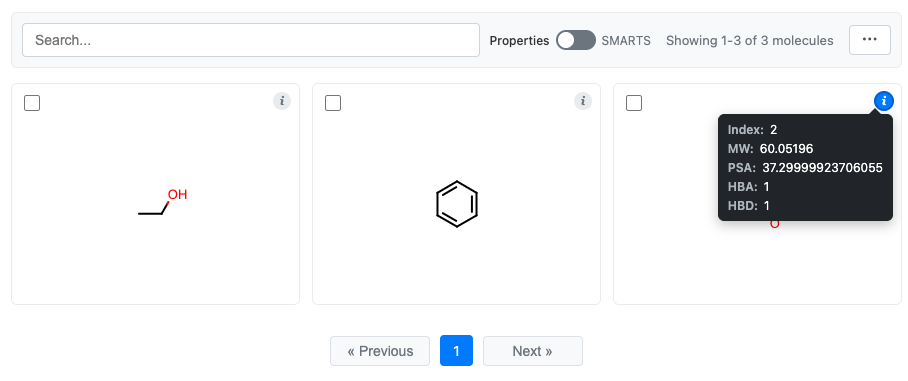
Configuring Displayed Data
Control what appears in the info tooltip using the data parameter:
# Display the grid and only show MW and PSA
grid = df.chem.molgrid("Molecule", data=["MW", "PSA"])
grid.display()
The tooltip always displays:
Index: The molecule’s position in the grid
Title: The molecule’s title (if set)
Data fields: Additional fields from the
dataparameter
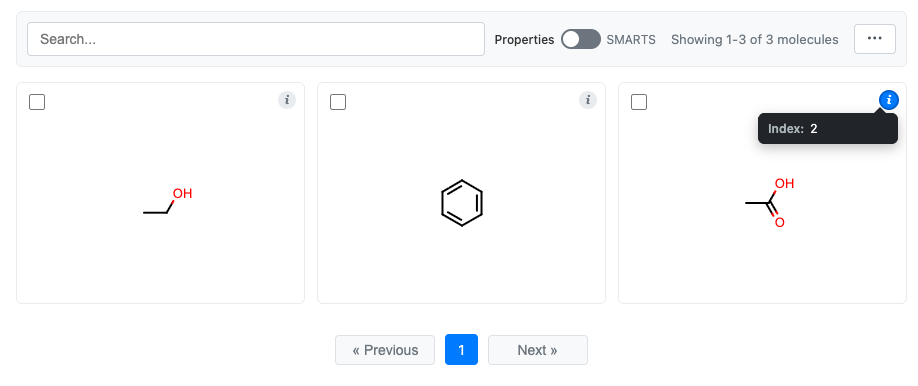
Disabling the Info Button
You can remove the info button if you don’t want to see it.
grid = MolGrid(molecules, information=False)
DataFrame Integration
Pandas
Pandas has both DataFrame-level and Series-level accessors for displaying molecule grids. The
DataFrame-level accessor will include other data from the DataFrame, the Series-level accessor will not.
Here is the same example as above:
import pandas as pd
from cnotebook import MolGrid
from openeye import oechem, oemolprop

# Create DataFrame
df = pd.DataFrame(
    {"Molecule": ["CCO", "c1ccccc1", "CC(=O)O"]}
).chem.as_molecule("Molecule")

# Calculate some properties
df["MW"] = df.Molecule.apply(oechem.OECalculateMolecularWeight)
df["PSA"] = df.Molecule.apply(oemolprop.OEGet2dPSA)
df["HBA"] = df.Molecule.apply(oemolprop.OEGetHBondAcceptorCount)
df["HBD"] = df.Molecule.apply(oemolprop.OEGetHBondDonorCount)

# Display the grid
grid = df.chem.molgrid("Molecule")
grid.display()
You can see that all the data has accompanied the molecules in the grid:
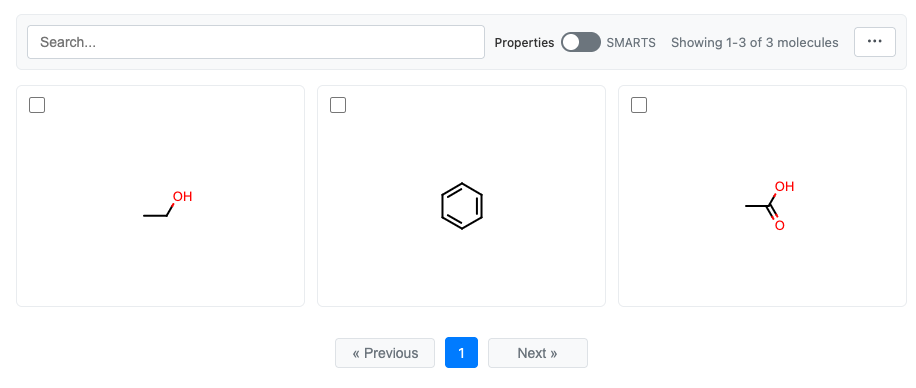
This is not the case with the Series-level accessor. It will just show the molecules:
# Display the grid
grid = df.Molecule.chem.molgrid()
grid.display()
Automatic Field Detection
When using a DataFrame, MolGrid automatically detects:
Search fields: String columns for text search
Info fields: All simple type columns (string, int, float) for the info tooltip
import pandas as pd
from cnotebook import MolGrid
from openeye import oechem, oemolprop, oeiupac

# Create DataFrame
df = pd.DataFrame(
    {"Molecule": ["CCO", "c1ccccc1", "CC(=O)O"]}
).chem.as_molecule("Molecule")

# Add the IUPAC name
df["IUPAC"] = df.Molecule.apply(oeiupac.OECreateIUPACName)

# Calculate some numerical properties
df["HBA"] = df.Molecule.apply(oemolprop.OEGetHBondAcceptorCount)
df["HBD"] = df.Molecule.apply(oemolprop.OEGetHBondDonorCount)

# Create the grid
grid = df.chem.molgrid("Molecule")

# Check what was auto-detected
print(f"Search fields: {grid.search_fields}")
print(f"Info fields: {grid.information_fields}")
You can see that only the string "IUPAC" column is searched.
Search fields: ['IUPAC']
Info fields: ['IUPAC', 'HBA', 'HBD']
Viewing Clusters
If your DataFrame has cluster labels (or if they are attached to your molecules as SD or OpenEye generic data), then
you can configure the molecule grid for cluster browsing by providing the cluster parameter.
import cnotebook
import pandas as pd
from openeye import oechem
# Example data
df = pd.DataFrame({
"Molecule": ['CCO', 'CC(=O)O', 'c1ccccc1', 'CC(=O)Nc1ccc(O)cc1',
'CC(C)Cc1ccc(C(C)C(=O)O)cc1'],
"Name": ['Ethanol', 'Acetic Acid', 'Benzene', 'Acetaminophen', 'Ibuprofen'],
"Cluster": ['A', 'A', 'B', 'B', 'C'] # Can be any type
}).chem.as_molecule("Molecule")
# Create the grid specifying that "Cluster" contains cluster labels
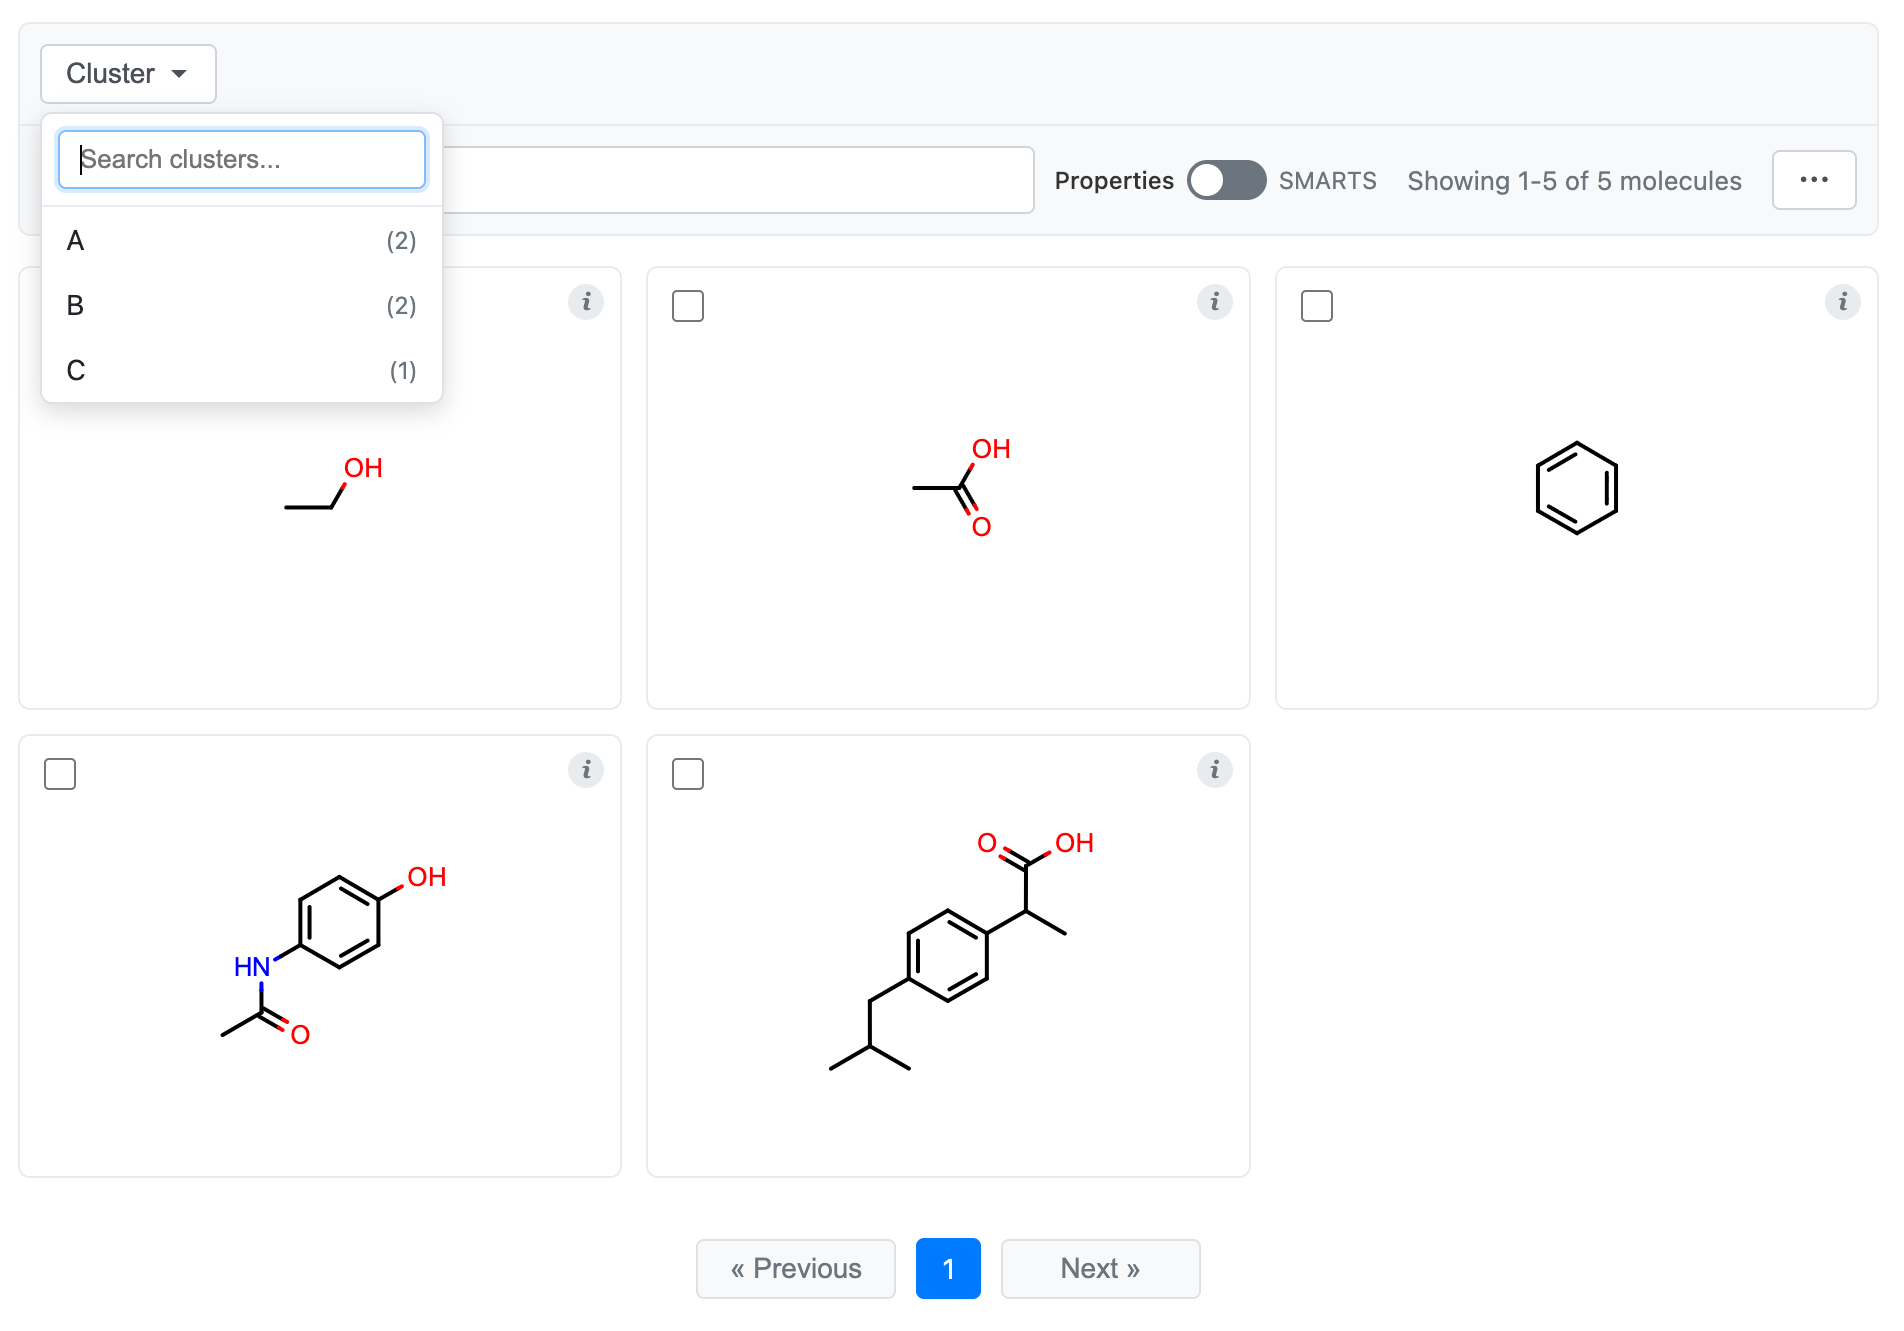
grid = df.chem.molgrid("Molecule", cluster="Cluster")
# Display the grid
grid.display()
You’ll now see a dropdown at the top that allows you to search and select cluster labels to view. Selecting a cluster will only show members of that cluster, and selecting multiple clusters will show the union of those clusters. Search will only search within the clusters that you have selected. Similarly, selections from the “…” menu (e.g., “Select All”) will only apply to the selected clusters.
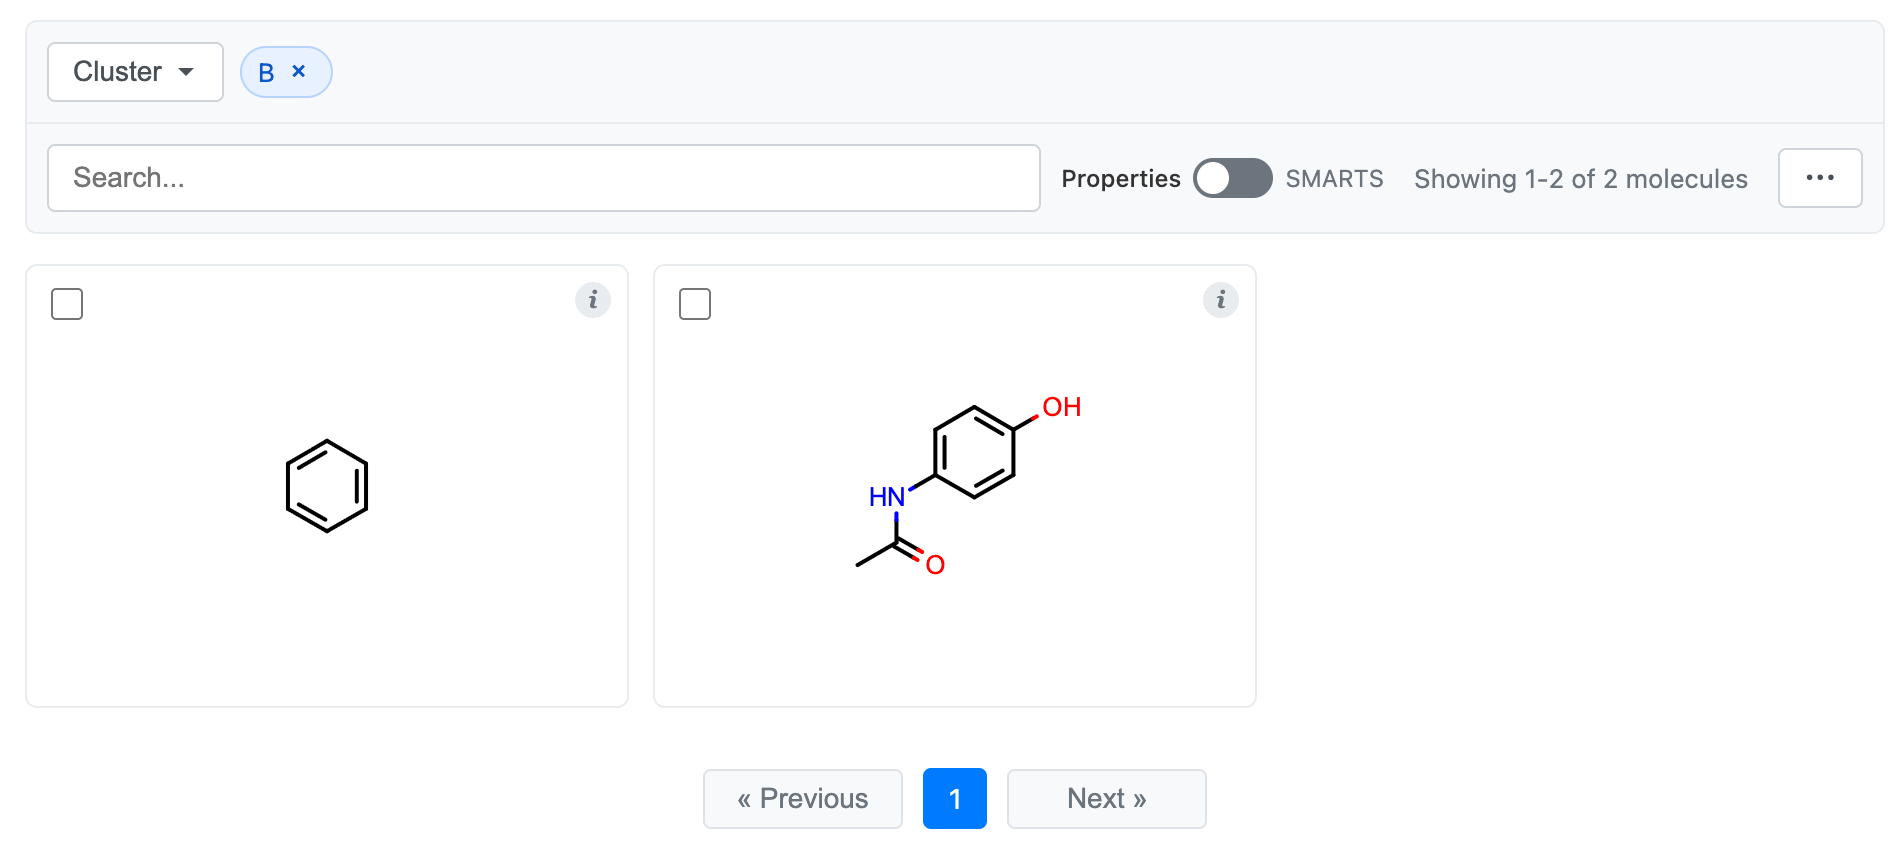
Selecting cluster label “B”:
API Reference
MolGrid Class
- class MolGrid(mols, *, dataframe=None, mol_col=None, title=True, tooltip_fields=None, n_items_per_page=24, width=200, height=200, atom_label_font_scale=1.5, image_format='svg', select=True, information=True, data=None, search_fields=None, name=None, cluster=None, cluster_counts=True)
Interactive molecule grid widget.
- Parameters:
mols – Iterable of OpenEye molecule objects
dataframe – Optional DataFrame with molecule data
mol_col – Column name containing molecules (required if dataframe is provided)
title – Title display mode. True uses molecule’s title, a string specifies a field name, None/False hides titles
tooltip_fields – List of fields for hover tooltip
n_items_per_page – Number of molecules per page
width – Image width in pixels
height – Image height in pixels
atom_label_font_scale – Scale factor for atom labels
image_format – Image format (“svg” or “png”)
select – Enable selection checkboxes
information – Enable info button with tooltip
data – Column(s) to display in info tooltip; auto-detects if None with DataFrame
search_fields – Fields for text search; auto-detects if None with DataFrame
name – Grid identifier for tracking selections
cluster – Cluster filtering mode. A string specifies a DataFrame column name containing cluster labels. A dict maps values to display labels. None disables cluster filtering.
cluster_counts – Show molecule count next to each cluster label in the dropdown. Defaults to True.
- display()
Display the grid in the notebook.
- Returns:
HTML object for display
- to_html()
Generate HTML representation of the grid.
- Returns:
Complete HTML document as string
- get_selection()
Get list of selected molecules.
- Returns:
List of selected OEMol objects
- get_selection_indices()
Get indices of selected molecules.
- Returns:
List of selected indices (sorted)
molgrid Function
- molgrid(mols, *, title=True, tooltip_fields=None, n_items_per_page=24, width=200, height=200, image_format='svg', select=True, information=True, data=None, search_fields=None, name=None, cluster=None, cluster_counts=True)
Convenience function to create an interactive molecule grid.
See
MolGridfor parameter documentation.- Returns:
MolGrid instance